Judge – First Instance Court
of Turin (Italy)
Member of the “Groupe de
pilotage” of the CEPEJ SATURN Centre of the Council of Europe
Enquiry
into the
“Customer
Satisfaction Survey in Turin Courts”
(2013
Edition)
|
Table of Contents: 1. Introductory Remarks. The
Turin Survey in the Framework of the Initiatives of the European Commission
for the Efficiency of Justice (CEPEJ) of the Council of Europe. – 2. Working Group and Timeframes of 2011 and 2013 Editions.
– 3. Methodology, Object and Target of Turin Survey. – 4. The Overall Impact and the Importance Given by Users to
Various Items of Provided Services. – 5. Outcome of the
Survey: Staff, Judges, Timeframes and Costs of Justice. – 6.
Overall Outcome of the Survey: Satisfaction and Importance. |
1. Introductory Remarks. The Turin Survey in the
Framework of the Initiatives of the European Commission for the Efficiency of
Justice (CEPEJ) of the Council of
Europe.
The
“Customer Satisfaction Survey in Turin Courts” belongs to the cooperative
activities that the Turin First Instance Court (Tribunale di Torino) carries out in its
capacity as a member of the Pilot
Courts Network of the CEPEJ
(Commission Européenne pour l’efficacité de la justice/European Commission for
the Efficiency of Justice) of the Council of Europe. The initiative draws its
origin from the activities of the Working Group on the quality
of justice of the CEPEJ (CEPEJ-GT-QUAL).
This panel (also on the basis of previous experiences realized at the Court of
Geneva) has recently edited a Handbook
on “Conducting Satisfaction Surveys of Court Users in Council of Europe Member
States.” This handbook, available on the Council of Europe’s web site, together
with other documents which have been drafted by the same organ, contains as
well a “Model Questionnaire for Court Users,” which can be used, with the appropriate
adjustments, in each and every Judicial Office willing to test the level of
satisfaction of people who, for any possible reason, contact such bodies.
Setting
up criteria and directives for the realization of surveys of this kind lies
within the fundamental scope of the CEPEJ,
that are the improvement of the efficiency and functioning of justice in member
States, and the development of the implementation of the instruments adopted by
the Council of Europe to this end. In order to carry out these different tasks,
the CEPEJ prepares benchmarks,
collects and analyses data, defines instruments of measure and means of
evaluation, adopts documents (reports, advices, guidelines, action plans,
etc.), develops contacts with qualified personalities, non-governmental
organisations, research institutes and information centres, organises hearings,
promotes networks of legal professionals.
Amongst
the Working Groups of CEPEJ, besides
the already mentioned panel on the themes of the quality of justice, we can also
mention the Groupe de Pilotage of the
“Centre for judicial time management (SATURN
Centre – Study and Analysis of judicial Time Use Research Network).” The
SATURN Centre is instructed to collect information necessary for the knowledge
of judicial timeframes in the member States and detailed enough to enable
member states to implement policies aiming to prevent violations of the right
to a fair trial within a reasonable time protected by Article 6 of the European
Convention on Human Rights. It should also be added that CEPEJ set up a Network of Pilot-courts from European States to
support its activities through a better understanding of the day to day
functioning of courts and to highlight best practices which could be presented
to policy makers in European States in order to improve the efficiency of
judicial systems.
2. Working Group and Timeframes of 2011 and 2013
Editions.
The
idea of running a satisfaction survey in Italy aimed at Court users is founded
upon the above mentioned guidelines prepared by the Quality Working Group of
the CEPEJ. The concrete input came at
the end of 2010 by the Director-General of Statistics of the Italian Department
of Justice, who invited the two Italian members of the Network of Pilot Courts,
which to say the First Instance Court of Turin and the Appeals Court of
Catania, to run a survey on the degree of customer satisfaction; the initiative
has also been extended to the Appeal Court of Turin, whose President, former
President of the local First Instance Court, Dr. Mario Barbuto, is the author
of the “Strasbourg Programme,” which, in the year 2001, constituted the first
concrete experiment of case management in Italy. Actually, it is due to this
programme that in 2006 the Turin First Instance Court was awarded by the
Council of Europe and the European Union a special mention in the framework of
the “The Crystal Scales of Justice Award.”
A
Working Group was therefore set up, under the coordination of the
Director-General of Statistics of the Italian Ministry of Justice (DGStat), Dr.
Fabio Bartolomeo. The panel comprised also, as
far as the Turin section was concerned, the President of the Appeals Court of
Turin, Dr. Mario Barbuto, the President of the First Instance Court of Turin,
Dr. Luciano Panzani, as well as Dr. Brunella Rosso, President of a Section of
the Appeals Court of Turin, Dr. Giacomo Oberto, Judge of the First Instance
Court of Turin, Dr. Roberto Calabrese, statistical expert of the Appeals Court
of Turin and Dr. Luigi Cipollini, statistical expert of the DGStat. The Working
Group was also comprised of the President of the Turin Bar, Avv. Mario Napoli,
as well as by the representatives of the Observatory on Civil Justice of Turin,
Avv. Raffaella Garimanno and Avv. Angelica Scozia, by Prof. Eugenio Dalmotto,
of the Law Faculty of the University of Turin, and by the person in charge of
organisation of decentralised training for judges in the Turin District of the
Appeals Court, Dr. Ombretta Salvetti, Judge of the First Instance Court of
Turin. The group was charged with defining the aims of the survey, to single
out the targets and to draft the questionnaire. Moreover it has monitored the
correct implementation of the survey and is currently ensuring the distribution
of its results.
In
its first meetings the aforementioned Working Group had proceeded towards the
drafting of the questionnaire, along the lines of CEPEJ guidelines, however introducing some adaptations to the
Italian reality. For instance the question about the clarity of Court summons
was eliminated, as in Italy summons are not issued by the Court, but by
lawyers. Also the question on the assistance by an attorney was eliminated;
actually, interviews were addressed also to people who were not parties to a
case; furthermore, the presence of a lawyer is in Italy an unavoidable
requirement in the vast majority of cases, which are lodged with the First
Instance and Appeal Courts. The Working Group therefore contacted the Law Faculty of the University
of Turin and in particular Prof. Eugenio Dalmotto, Professor of Civil
Procedural Law, who organized and made available a group of approximately 25
students. These people materially carried out the survey, spreading the
questionnaire and gathering answers to it. In view of developing this activity,
the Working Group held some preparatory meetings with the students, in order to
train them to run the survey questionnaire and illustrate the scope and
modality of surveying.
It
has also to be added that, as far as the first edition of the survey held in
2011 is concerned, the rigorous timeframes set in the first meeting of the
Working Group, which was held at the Ministry, in Dr. Bartolomeo’s office, on
12th October 2010, have been fully complied with. So the
questionnaire was finalised by the end of November 2010; after this the
initiative was explained to the aforementioned group of students, who were
appropriately trained between December 2010 and January 2011. Interviews of
customers were conducted with the delivering of 618 questionnaires in the
period between January and March 2011. After each interview, conducted by a
student on the basis of the questionnaire, answers provided were verified and
inserted via the web in the appropriate data bases; final data was analysed and
elaborated in the framework of a conclusive report, available at the following
web page: http://giacomooberto.com/Oberto_report_survey_satisfaction.htm.
In
the framework of the above mentioned meetings, the Working Group had also
decided to repeat, if possible, every two years the initiative. For this
reason, the same Working Group was reconstituted in the spring of 2013. A new
group of students of the Law Department of the Turin University, under the
guidance of Prof. Eugenio Dalmotto, was therefore set up. After a training
activity of the students held by the Working Group, it was decided, in the
months of April and May 2013, to deliver a total of 641 questionnaires. The
results were presented in Turin on 24 October 2013, in the framework of the
European Day of Civil Justice.
3. Methodology, Object and Target of Turin Survey.
Also
for the 2013 Edition the Working Group decided in the first place to single out
the judicial offices in which customer satisfaction should be measured. For
this purpose the panel decided to choose, as it had been done in the 2011, the
First Instance Court and the Appeals Court of Turin, having regard to both
civil and penal sectors. This was also intended to provide the possibility to
make a comparison between 2011 and 2013 results. Prosecution offices before said Courts were excluded,
as well as, for logistical reasons, the Juvenile Court, the Offices of the
Justice of the Peace and the four Detached Sections (i.e.: sections pertaining
to other cities situated within the boundaries of Turin district) of the First
Instance Court. This was expressed in question No. 1 of the questionnaire
(Q.1); replies are condensed in Diagram 1.
|
2011 Survey |
2013 Survey |
|
|
|
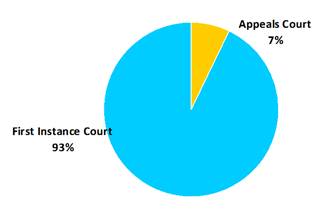
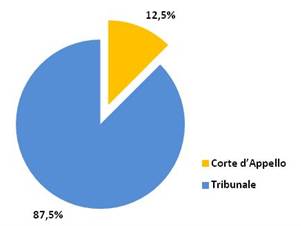
Diagram 1 – Courts serving interviewees.
While
2011 diagram shows that 93% of the interviewed people were served by the Court
of First Instance (Tribunale),
whereas the remaining 7% to the Appeals Court (Corte d’Appello), 2013 diagram shows an encreased number of Court
of Appeal “users.” (12.5%, against 87.5% First Instance Court “users”). 2011
percentage roughly reflects the existing ratio between the total number of
cases lodged with the First Instance Courts of the District and cases pending
before the Appeals Court.
As
far as the target of the survey is concerned, the above mentioned panel decided
to confirm in 2013 the choice made two years before, which is to say not to
involve practitioners. Therefore the questionnaire was not addressed to judges,
lawyers, trainee lawyers, Court clerks and other employees of the justice
administration system. It was decided instead to focus on parties, witnesses,
jurors, relatives of parties or witnesses, Court’s or party’s experts,
interpreters. The reason of such decision is that practitioners like judges,
prosecutors, magistrates, lawyers and employees of the administration of
justice already dispose of institutions (associations, bar and professional
organisations, trade unions, etc.) which may bring to the outside world
impressions, needs and “moods” of such professionals of justice.
Scope
of the survey, in its various articulations, was to provide a general idea on
following three fundamental aspects: a) expectations, b) importance of services
and c) satisfaction and perception about rendered services. Diagram 2 shows
overall data breakdown by various categories of users.
|
2011 Survey |
2013 Survey |
|
|
|
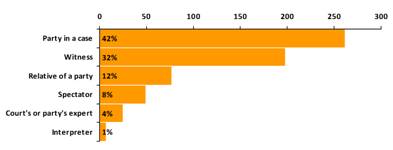
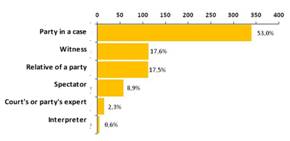
Diagram 2 – Data breakdown by various categories of users.
Diagram
2 shows that a high number of people visiting the Turin Palace of justice were
in the category of parties in a lawsuit. In particular, the figure referred to
the relatives of a party and to the spectators, whose two percentages reached
in 2011 a total figure of 20%, was surprisingly high. This figure encreased in
2013 up to 26.4%.
Collected
data shows that interviewed people were predominantly male, of almost all ages;
such people were in their majority married; they had (at least) an advanced
secondary school certificate and a full time job. The majority of full time
employed people are civil servants and private enterprise employees, followed
by freelancers, workers, entrepreneurs and independent workers. The majority of
interviewed people have shown to be able to orient themselves in judicial
offices, without previously collecting information by phone or in another way,
as it is illustrated in Diagram 3.
|
2011 Survey |
2013 Survey |
|
|
|
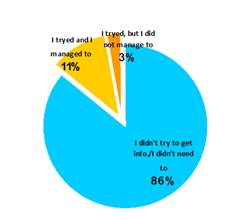
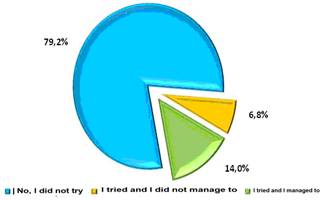
Diagram 3 – Information gathered by customers prior to visiting a Court.
Data
gathered from the answers to the survey shows that the overwhelming majority of
customers either did not try to get information by phone, email or on the Web Site,
or they said they did not need to gather information. However, it is important
to point out that, out of the part of customers who tried to get information,
the vast majority succeeded in their quest.
A
novelty of the investigation carried out in 2013 concerned the Office for
Relations with the Public (Ufficio per le
Relazioni con il Pubblico – URP). The results show that only a small
percentage of the respondents (12.7%) decided to seek information from that
structure. It is however reassuring that the vast majority of them were
satisfied (10%, against 2.7% of people who declared themselves unsatisfied).
|
2013 Survey |
|
|
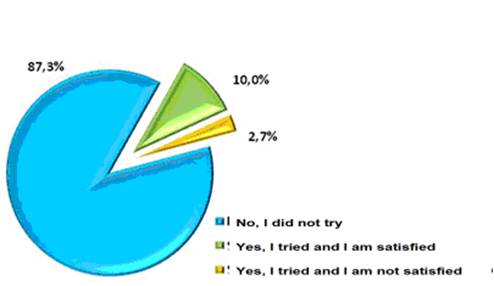
Diagram 4 – Information
gathered by customers from the URP.
Other meaningful information is supplied by the
breakdown of categories of procedures, as illustrated by Diagram 4.
|
2011 Survey |
2013 Survey |
|
|
|
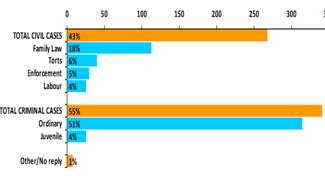
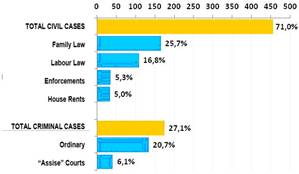
Diagram 5 – Breakdown categories of procedures involved.
The
percentage breakdown of user data for number of procedures involved show very
different results in the two editions under review. The preponderance of the
criminal sector in the 2011 edition is probably due to the fact that in the
period in which questionnaires were delivered, many hearings were taking place
in the framework of some very “mediatized” criminal cases (Thyssen and Eternit
cases), which attracted a large number of injured parties, witnesses and
spectators. Probably the 2013 edition reflects a situation closer to the
everyday life of the court.
A
further element allowing a better knowledge of users’ needs concerns the number
of times interviewed users have visited Turin judicial offices, as illustrated
in Diagram 5.
|
2011 Survey |
2013 Survey |
|
|
|
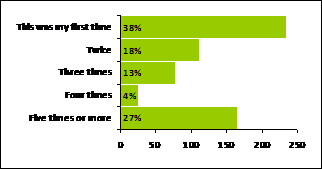
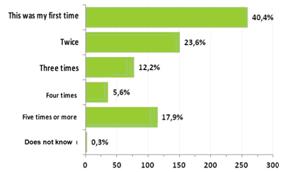
Diagram 6 – Number of times interviewed users have been visiting
Turin judicial offices.
Rather
unexpected is the figure concerning the frequency with which respondents have
been visiting Turin judicial offices. The total of those who have visited those
offices more than once in fact exceeds the number of those for whom it was
their first visit. Rather impressive was the result of the analysis carried out
in 2011, concerning the figures of those who reported to have been visiting five or more times the same
office (27%). Such figures—which seemed to show the existence of a category of
“frequent visitors” of judicial offices—was reduced in 2013 of almost ten
points (17.9%). Once again, the result has to be referred, most probably, to
the presence, in 2011, of hearings relating to proceedings which were object of
particular attention in the media.
4. The Overall Impact and the Importance Given by Users
to Various Items of Provided Services.
Diagram 6 records what could be defined as “the
overall impact:” the general impression customers get about services provided
by Turin judicial offices.
|
2011 Survey |
2013 Survey |
|
|
|
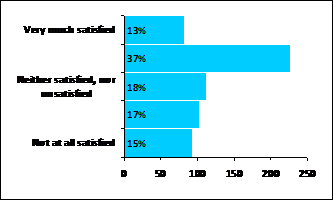
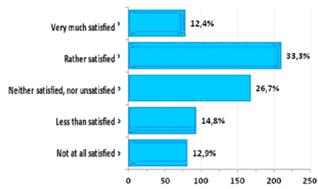
Diagram 7 – General impression customers get about services
provided by Turin judicial offices.
General
data gathered in 2011 could be seen as rather reassuring, as it turned out that
the sum of those who declared themselves very much satisfied and of those who
declared themselves enough satisfied reached the threshold of 50%, while the
total number of people who declared themselves less than (or not at all)
satisfied was less than one third of the total. Data concerning 2013 show a
reduction of the figures of both “globally satisfied” (from 50% to 45.7) and
“globally unsatisfied” (from 32-% to 27.7%) people, while we witness a certain
growth of the number of “indifferent” customers, who declare themselves neither
satisfied, nor unsatisfied (from 18% to 26.7%).
Data
summarised in Diagram 7 is of great interest, as it refers to the importance
customers attach to various characteristics of services offered.
|
2011 Survey |
2013 Survey |
|
|
|
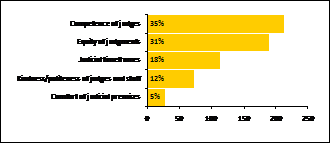
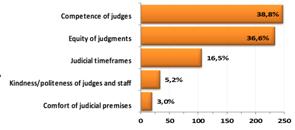
Diagram 8 – Importance given to various elements of services
offered.
Amongst
all the elements which appear essential for the customers’ judgment, one of the
most relevant is the competence of judges (from 35% in 2011 to 38.8% in 2013).
Users declared to prefer such item, although slightly, to the fairness of
judgment (from 31% in 2011 to 36.6% in 2013). We find rather distanced,
notably, data on the duration of procedures (down from 18% in 2011 to 16.5% in
2013); finally, the weight accorded to kindness/politeness of judges and of the
staff appears to be less and less significant (from 12% in 2011 to 5.2% in
2013), as well as the comfort of judicial premises (from 5% in 2011 to 3% in
2013). Such information allows us to adequately assess and “calibrate” data
emerging from Diagrams 8b, 8c and 8d.
Some
other elements allowing us to assess general impact concern the logistics of
judicial services: particularly premises (location, comfort, cleanness, clarity
of signage within the courthouse) and working hours, as illustrated in Diagram
8a.
|
2011 Survey |
2013 Survey |
|
|
|
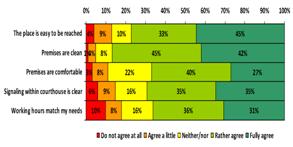
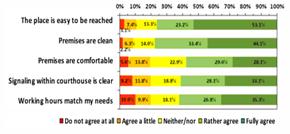
Diagram 9a – Assessing the logistics: premises and working
hours.
The
overall judgment on the above mentioned results on evidence concerning logistical
aspects of Turin’s Justice Palace, and to the services supplied there, appears
more than gratifying. The sum of the percentages of those who declared
themselves fully or rather in agreement with the appraisal in positive terms on
feasibility, cleanliness and comfort of the premises, clarity of signage within
the courthouse and convenience of working times, reaches a total number of
people who often exceed two thirds and always 60% of the total of interviewed
people, while the relative “level of dissatisfaction” (which is comprised of
the percentages of those who declared themselves partially or not at all in
agreement) never reaches 20%. On this point figures relating to 2011 and
figures concerning 2013 are practically matching.
5. Outcome of the Survey: Staff, Judges, Timeframes and
Costs of Justice.
The
most important and interesting part of the questionnaire relates to a series of
elements that, in the process of drawing up the questionnaire, the Working
Group thought indispensable for an accurate assessment of services offered to
users. Therefore the panel decided to put the focus, in the first place, on
such elements as: easy recognisability, competence, availability and clarity of
the staff, as it is shown in Diagram 8b.
|
2011 Survey |
2013 Survey |
|
|
|
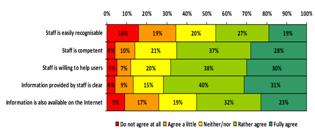
Diagram 8b – Assessing the
staff.
Apart
from the item of staff’s easy recognisability and the availability of
information on the Internet and other sources of information, other questions
related to the clerical staff indicate a high level of satisfaction. Having
said this, we notice a decrease in 2013 of all positive results, if compared to
2011 edition. As a matter of fact, the number of those people who declared
themselves as rather or fully agreeing on items such as the competence of the
staff, their availability to help customers and to provide clear
information—still exceeding half of the interviewed people in 2011—was about
two-thirds, whereas in 2013 is about 60%. The degree of dissatisfaction on
these very items was in 2011 around 15%, whereas in 2013 grows up to 20%.
Coming now to the judges, the idea has been to focus
attention on elements such as their capability to inspire trust and confidence,
their competence, impartiality, politeness and the ability to express
themselves with clarity, as it is shown in Diagram 8c.
|
2011 Survey |
2013 Survey |
|
|
|
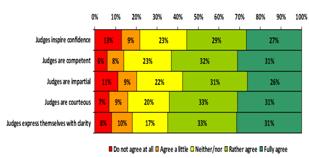
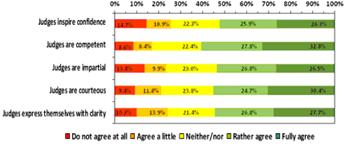
Diagram 8c – Assessing the
judges.
Also
with reference to the issue of assessment of the judges continues to be
comforting, despite the fact that in this field as well a certain “erosion” of
positive results scored in 2011 has to be recorded. As a matter of fact, the
overall level of satisfaction (that is the sum of data of those who declared
themselves rather in agreement and of those who said they fully agreed with the
assertion that judges inspire trust and confidence, that they are competent,
impartial, polite, and that they are able to express themselves with clarity)
is always higher than 50%, but a few percentage points have been lost. So the
degree of trust and confidence in the judges has decreased from 56% to 52.2%,
the assessment of competence from 61% to 55.1% and the assessment on the
ability of judges to express themselves with clarity has been decreasing from 65%
to 54.5%.
Relative
percentages of dissatisfaction, which in 2011 oscillated between 14 and 22%,
are now oscillating between 17% and 25.6%. Such results, also in the 2013
edition of the survey, seem rather surprising, especially when we think of the
campaign of systematic denigration and delegittimation of the judiciary, which
is currently present in Italy. The data appears all the more comforting, if we
note that the level of importance attributed to the above mentioned items is
the highest which has been registered (see above, Diagram 7 and relative
comments). However, the situation has to be constantly monitored, in order also
to understand whether the observed slight decrease in the positive data is a
symptom of a malaise in development, or just a transitional phenomenon.
Coming, finally, to the assessment of time and cost, the Working Group
decided to ask questions concerning: fairness of costs for litigation,
reasonableness of timeframes, punctuality of hearings, overall organization of
the judicial office and the possibility to obtain information easily, as it is
shown in Diagram 8d.
|
2011 Survey |
2013 Survey |
|
|
|
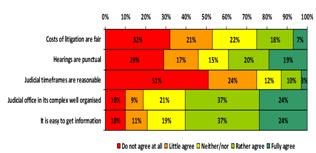
Diagram 8d – Assessing
timeframes and costs of justice.
Diagram
8d is unique in providing alarming evidence on the current situation of the
system. Customers’ assessment about reasonableness of judicial timeframes, in
2011 as in 2013, is merciless: actually, the level of dissatisfaction reaches
75%, against 13% of those who declared themselves rather or fully in agreement
with the assertion that the reasonable duration of the procedures is concretely
assured. Such an outcome is astonishing, in the light of the positive results
of the “Strasbourg Programme” (that allowed the Turin First Instance Court to
achieve far better results than those of the other Italian courts). However,
such a shortcoming can be at least in part mitigated by the fact that the level
of importance that customers attach to the reasonable duration of process
appears remarkably inferior to the one attributed to the competence of judges
(see above, Diagram 8c).
Data
mentioned above can perhaps be explained in the light of the fact that the
survey also comprises criminal trials and that, whereas the whole civil process
is managed by the Court, the criminal trial is managed by two different
offices: the Public Prosecutor’s Office in the first place and the Court in the
second place. Therefore we have also to take into account possible delays in
the Public Prosecution Office. A surprising weak spot, at least as far as Turin
is concerned, is constituted also by data concerning punctuality of hearings:
in 2011 46% of people declared themselves unsatisfied, against 39% who declared
themselves satisfied; in 2013, 42.5% of people declared themselves unsatisfied,
against 34.4% who declared themselves satisfied (in the second edition of the
survey the number of customers declaring themselves neither satisfied nor
unsatisfied encreased in a remarkable way). This outcome can be explained with
regard to the fact that many of interviewed people were involved in penal
proceedings, and for such hearings (unlike civil hearings) no system of
staggering is in use.
No
surprise comes from data on the assessment of judicial costs, which were deemed
in 2011 as not fair by 53% and fair by 25% of interviewed people. Such
percentages were in 2013 respectively 55% and 18.3%. On the contrary, data on
the overall organisation of judicial office continue to appear comforting (61%
of interviewed people declared themselves satisfied, against 19%, who declared
themselves unsatisfied in 2011; 55,6% declared themselves satisfied, against
21.6%, who declared themselves unsatisfied in 2013. The same is true for data
concerning availability of information (61% satisfied, against 21% unsatisfied
in 2011; 58.2 satisfied, against 21.6% unsatisfied in 2013).
6. Overall Outcome of the Survey: Satisfaction and
Importance.
The
empirical data gathered by the survey can be represented graphically by
cross-referencing the replies of interviewed people on issues pertaining to
satisfaction about services rendered by Turin judicial institutions with
replies on the various characteristics (items) considered as regards their
importance. In this graph (see Figure 1) it is possible to determine four
distinct areas. Such areas are defined by drawing two lines across, on the
points of the two axes (abscissae and ordinates) matching respective average values.
Data concerning “importance” was statistically derived using the Spearman
correlation index between each specific item and the overall satisfaction.
Spearman’s rank correlation coefficient is a non-parametric measure of
statistical dependence between two variables. It assesses how well the
relationship between two variables can be described using a monotonic function,
either always increasing or always decreasing.
Items
falling within the square situated in the upper-right part of the map are those
which are considered as important by users and that at the same time received a
high satisfaction score. This explains why we could define this area as an
“Area of Excellence,” (“High Importance-High Satisfaction”), to be constantly
monitored and valued in the interest of a better service to the citizens. A
high importance (above the average), associated to a low degree of satisfaction
(under the average), characterizes the area situated in the lower-right part of
the diagram, that is the area of the “needs which are not adequately
satisfied,” or “Area for Improvement” (“High Importance-Low Satisfaction”). The
items of this part of the map require a great deal of attention.
A low
degree of importance associated to an elevated degree of satisfaction characterizes
those items which, in spite of a positive assessment by the customers, are not
perceived as essential. Therefore, for these items keeping the same level of
quality can be deemed sufficient (see the upper-left area of the diagram, which
could be called “Area for Maintenance”: “Low Importance-High Satisfaction”).
Finally, relatively negligible are those items which, although characterised by
a low level of satisfaction, are considered by customers as less important than
others (see the lower-left area of the diagram, which could be called our “Area
of Indifference”: “Low Importance-Low Satisfaction”).
It
must be noted that in the “Area of Excellence” we can find nearly all the items
related to politeness, competence, clarity and impartiality of the judges, a
couple of items pertaining to the staff (competence and availability), as well
as the good organization of the offices and to the easiness to gather
information.
|
2011 Survey |
2013 Survey |
|
|
|
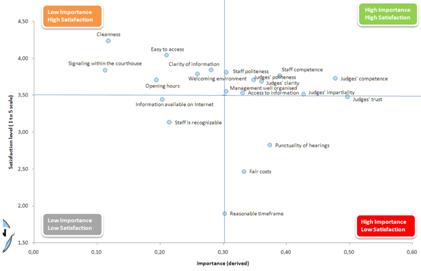
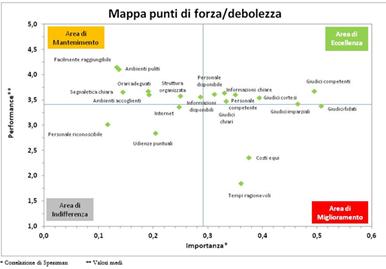
Figure 1 – Satisfaction vs. Importance Diagram.